CryoTEMPO-EOLIS now monitors the change of the world’s glaciers!
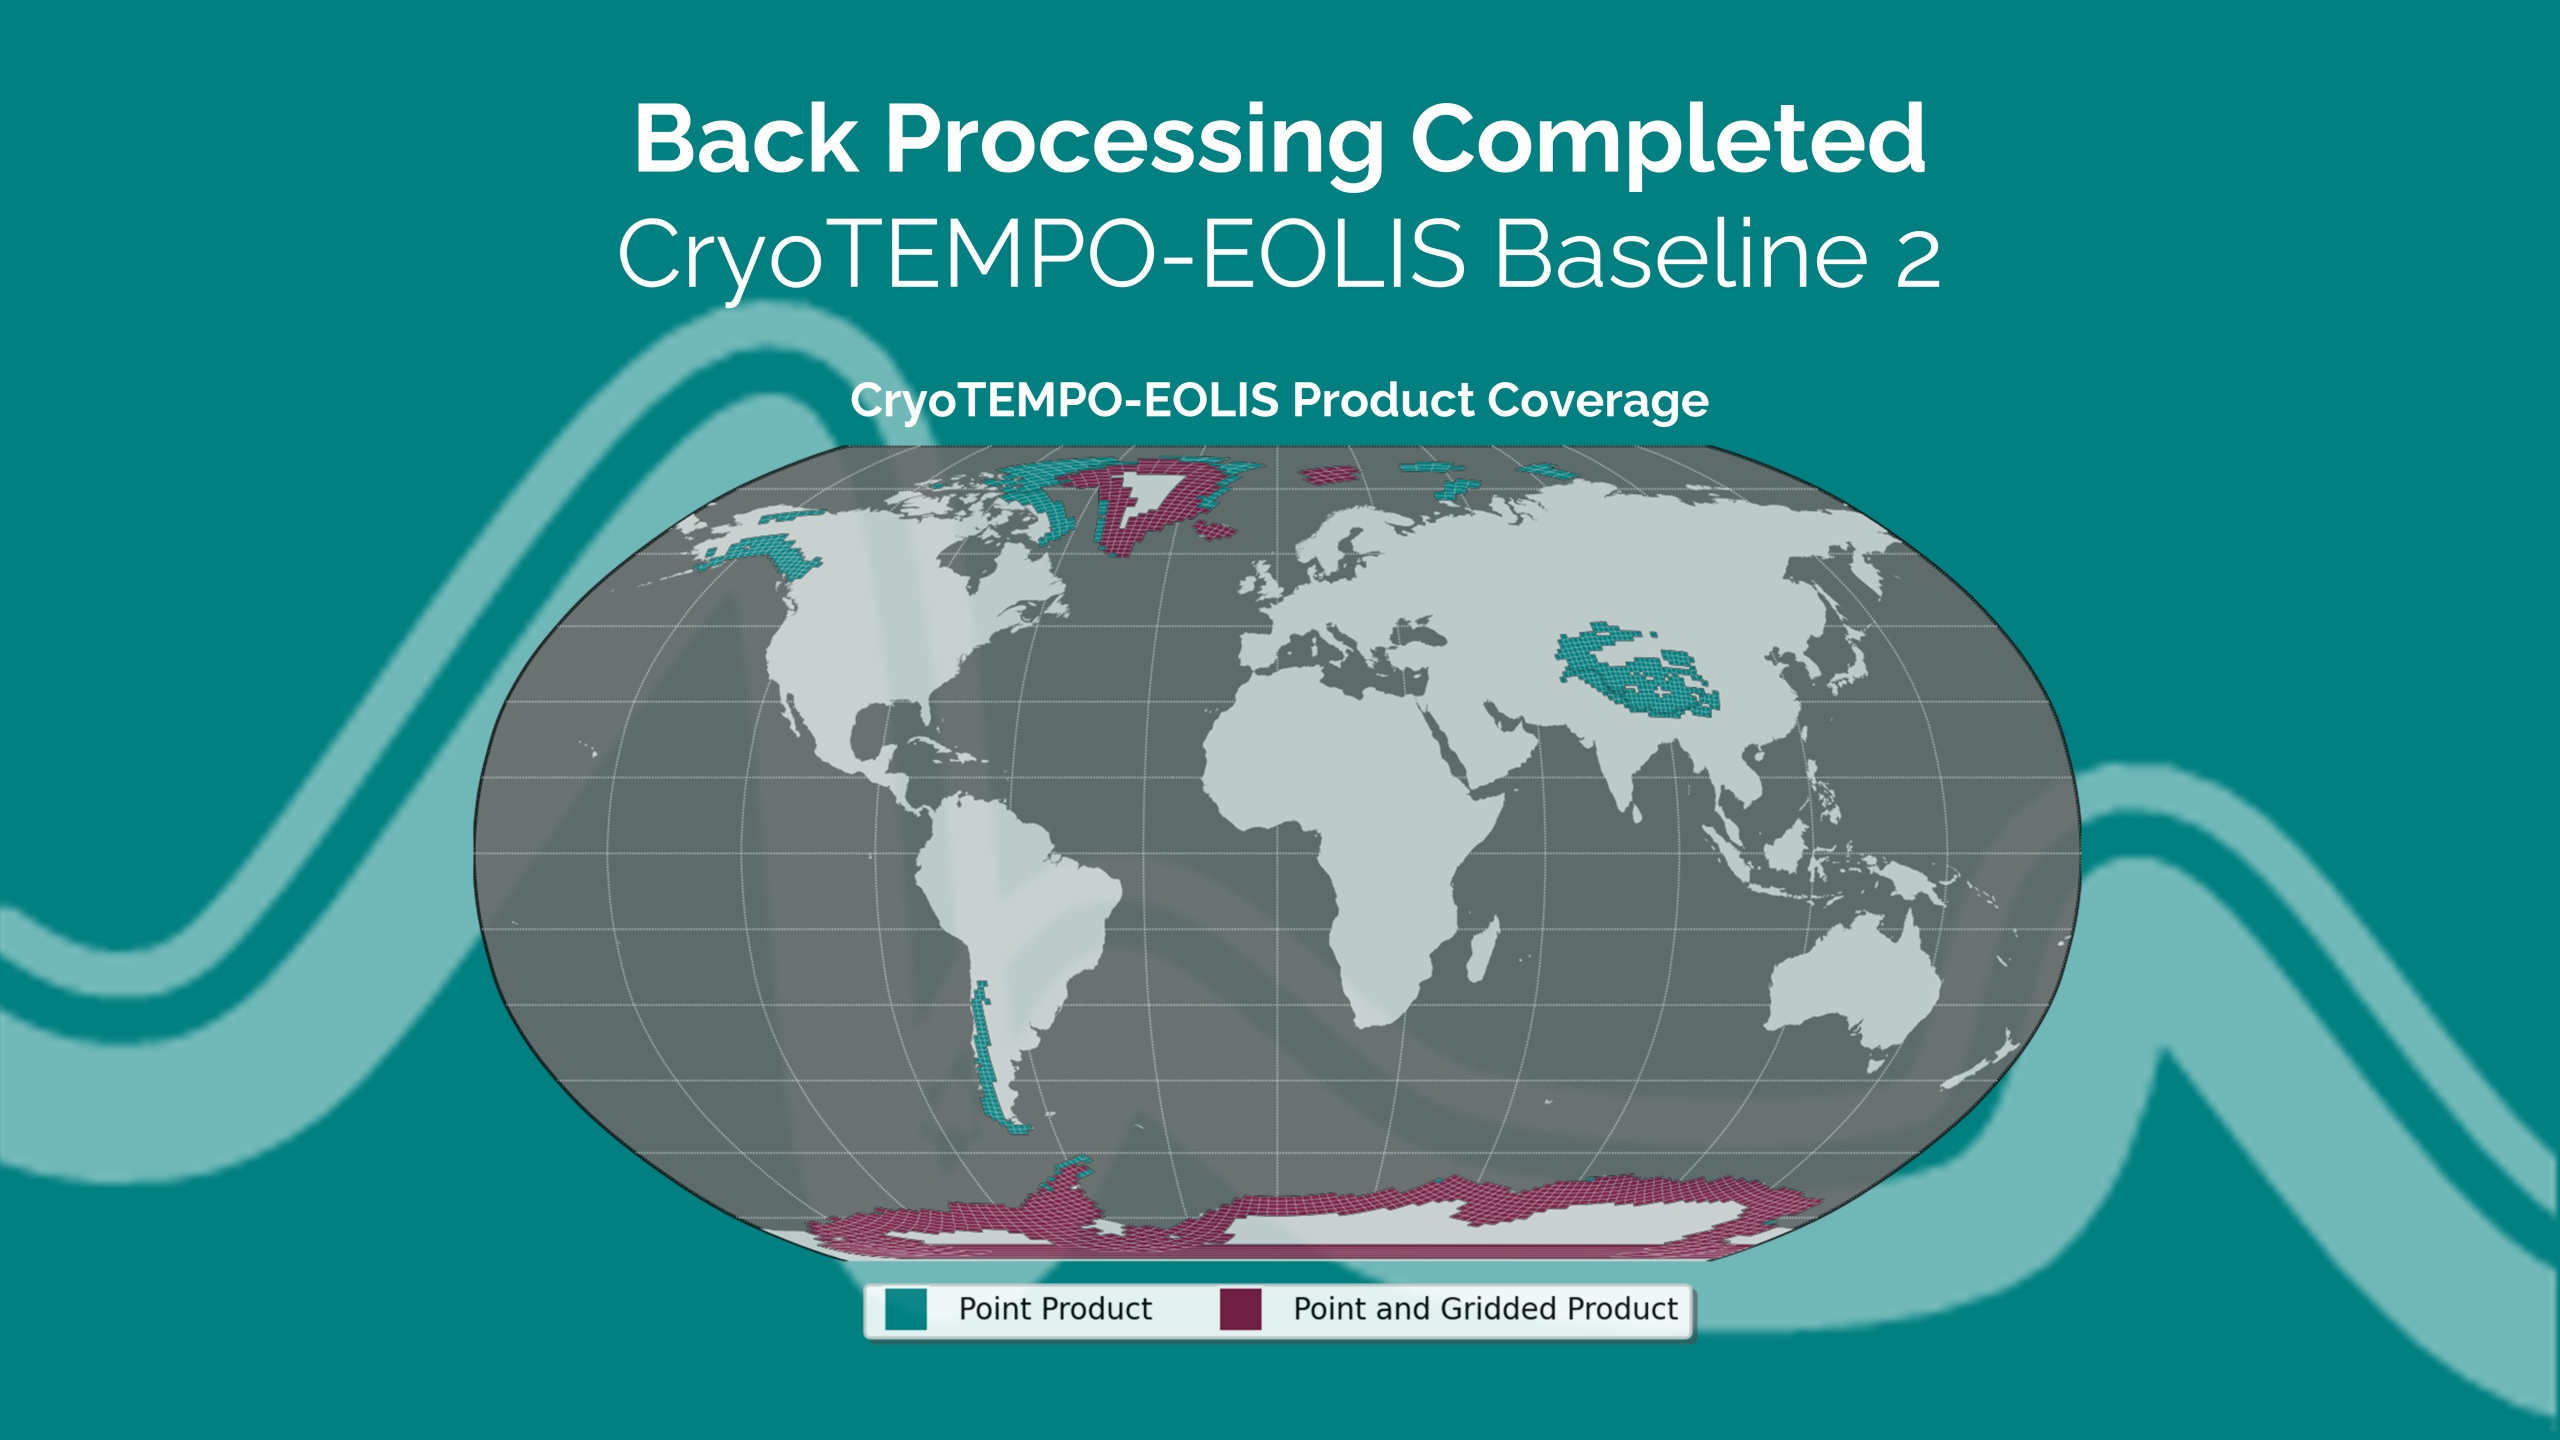
Glaciers around the world are melting faster than ever. One way to observe these rapid changes are the ESA CryoTEMPO EOLIS (Elevation Over Land Ice from Swath) products, which exploit CryoSat’s SARIn mode and the novel swath processing technique (Gourmelen et al., 2018) to provide increased spatial and temporal data coverage over land ice. The newly released CryoTEMPO EOLIS Baseline 2 version is now fully back processed with altimetry data available for the last 13 years. Baseline 2 boasts a significant improvement over the products previous version. The major update however is that EOLIS now also covers the world’s glaciers (Jakob & Gourmelen, 2023; Berthier et al., 2023), meaning we can now observe glaciers’ behaviour at even higher detail than before.
Here we have a look at a selection of glaciers across the world and show how they are perceived by the CryoTEMPO EOLIS dataset. From the Airy–Rotz–Seller–Fleming glacier system on the Antarctic Peninsula, to Síðujökull and Skaftárjökull glaciers on Vatnajökull ice cap in Iceland, and finally the Academy of Science Ice Cap Russian Arctic; glacier behaviour is complex, as they can display very different responses to a changing environment.
Airy–Rotz–Seller–Fleming glacier system on the Antarctic Peninsula
Excluding outlet glaciers on the ice sheets, Seller glacier on the Antarctic Peninsula is the world’s largest glacier by area, measuring over 7,000 square kilometres (Windnagel et al. 2023). The collapse of the Wordie Ice Shelf occurring between 1966 and 1989 and its loss of buttressing led to a long-term dynamic adjustment and thinning of the glacier (Rignot et al. 2005). The frontal position of the Wordie Ice Shelf has continued to retreat, with the ice front position at the Airy–Rotz–Seller–Fleming glacier system retreating further than surrounding glaciers (Figure 1).
Decades after the break-up of the ice shelf, we still observe a much higher thinning rate over the Airy–Rotz–Seller–Fleming glacier system compared to surrounding glaciers on the Antarctic Peninsula. CryoSat-2’s monthly repeat rate enables us to get a clear picture of changes in glaciers’ behaviour over time using the CryoTEMPO EOLIS data. The thinning of Seller glacier has fluctuated over the past 13 years (Figure 1), influenced by large-scale changes in the El Niño Southern Oscillation (ENSO) and the Southern Annular Mode (SAM) (Walker and Gardener 2017). The future of the Airy-Rotz-Seller-Fleming glacier system remains unclear; the grounding line has retreated due to strong upwelling of circumpolar deep water, and the retrograde slope of the bedrock beneath Fleming glacier could cause this retreat to increase in speed destabilising the glacier and ultimately resulting in a higher contribution to sea level rise (Peter Friedl et al. 2017).
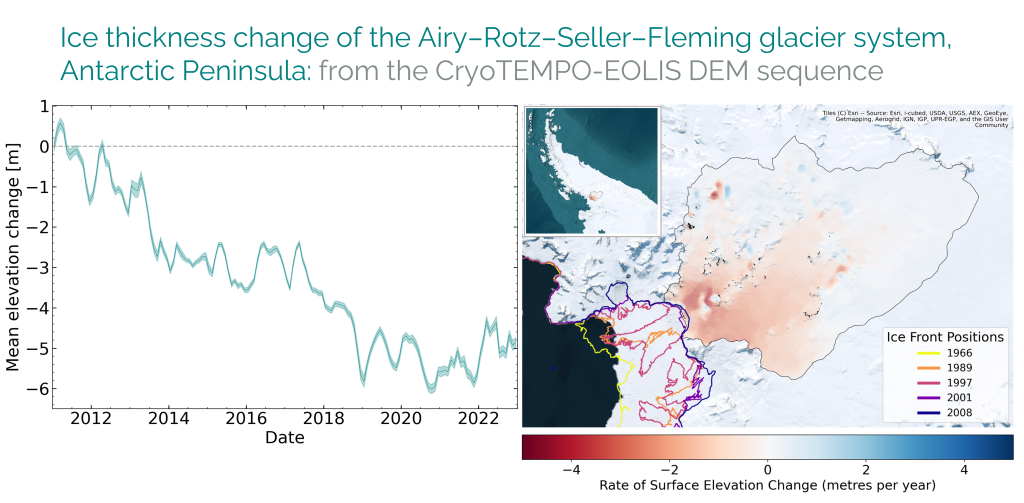
Figure 1: Left: elevation change time series of the Airy–Rotz–Seller–Fleming glacier system located in the Antarctic Peninsula. Right: rate of surface elevation change between January 2011 and December 2022 in metres per year with changes in ice front position for Wordie Bay (Cook et al. 2021).
Síðujökull and Skaftárjökull glaciers on Vatnajökull ice cap, Iceland
Let’s shift our focus to the Northern Hemisphere, and look at Síðujökull and Skaftárjökull, two land terminating outlet glaciers on the Vatnajökull ice cap in Iceland. In contrast to the Airy–Rotz–Seller–Fleming glacier system on the Antarctic peninsula, glacier thinning on Síðujökull and Skaftárjökull is largely driven by altitude. At the lowest altitudes (< 1000 metres) the mean change rate observed by the EOLIS data is -2.2 metres per year, whereas at higher altitudes (> 1500 metres) the ice thickness is observed to increase on average by 0.4 metres per year. Seasonal cycles are clear at moderate elevations (1000m to 1500m) with accumulation in winter months and ablation during the summer (Figure 2).
Skaftárjökull acts as an outlet for subglacial lakes beneath the Eastern and Western Skaftá cauldrons which have formed due to subglacial geothermal activity. Outburst floods occur approximately every two years as these cauldron overflow and drain through channels underneath the glacier into the Skaftá river at hundreds to thousands of cubic metres per second which equates to up to one olympic swimming pool of water discharged per second (Eibl et al. 2022).
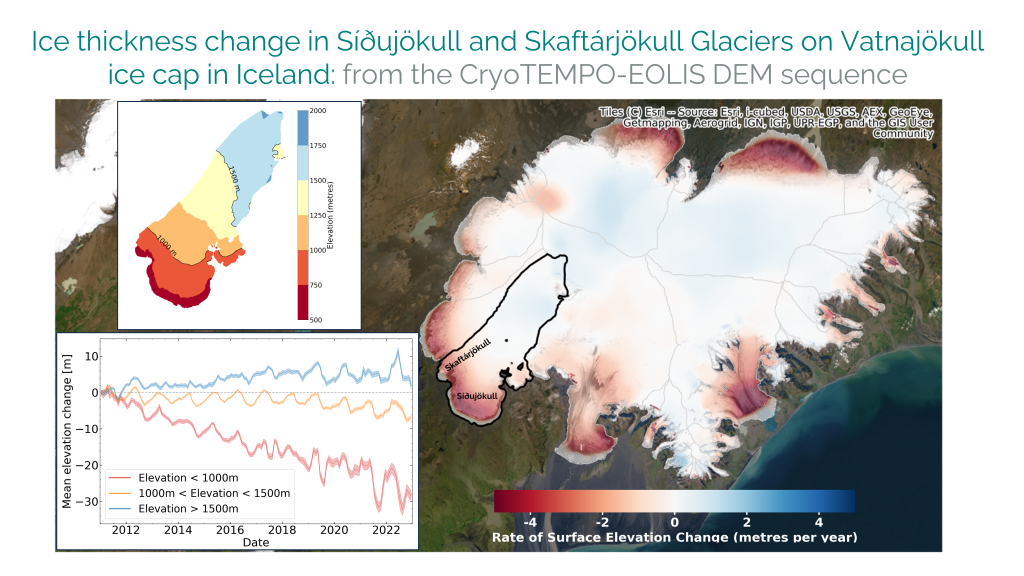
Figure 2: Left: bottom: elevation change time series of different elevation bands within Síðujökull and Skaftárjökull of Vatnajökull ice cap in Iceland, top: map showing the different elevation bands for the glaciers. Right: rate of surface elevation change between January 2011 and December 2022 in metres per year.
Academy of Sciences ice cap, Severnaya Zemlya, Russian Arctic
The Airy–Rotz–Seller–Fleming glacier system and Vatnajökull ice cap are almost on opposite sides of the world, displaying very different mechanisms of ice loss. However, different behaviours can also be observed on the same ice cap!
The Academy of Sciences ice cap located on the archipelago Severnaya Zemlya in the Russian Arctic, is interesting as it displays areas of both accumulation and ablation. In the North and North-West of the ice cap the drainage basins appear, for the most part, to be thickening slightly. However, the South and South-East show areas that are dynamically thinning (Figure 3).
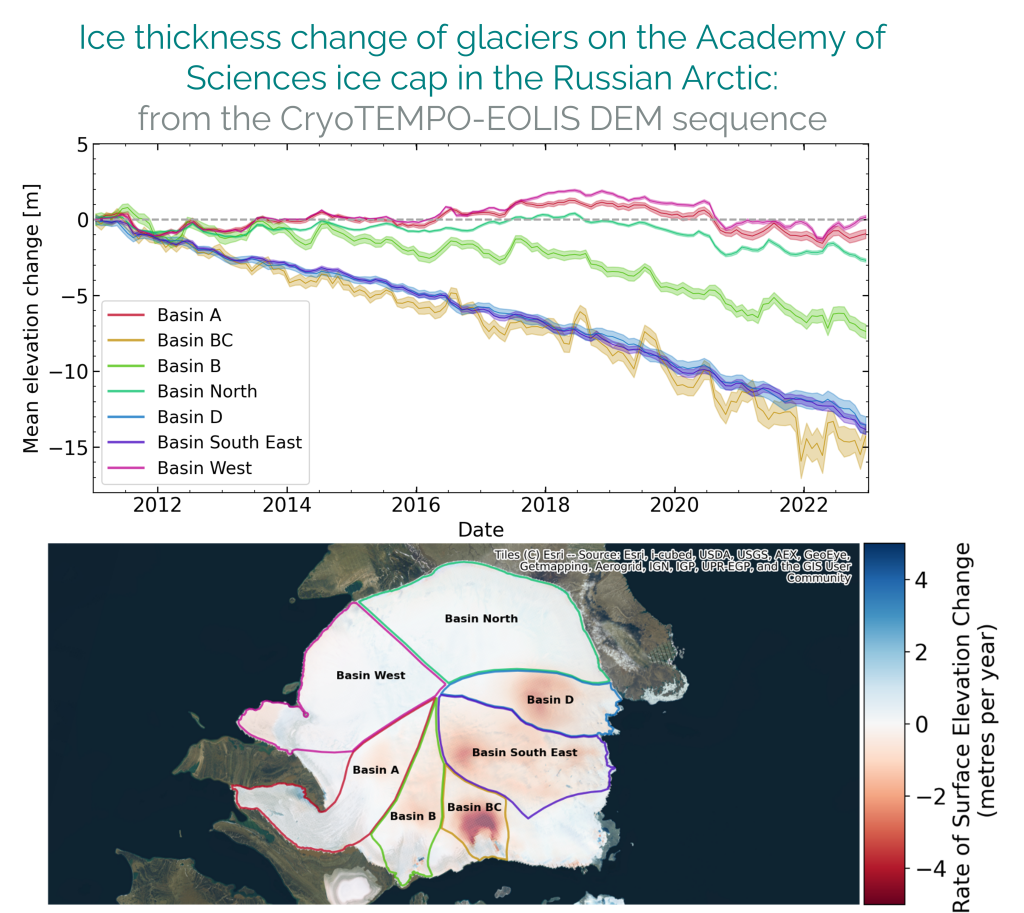
Figure 3: Top: elevation change time series of different basins located on the Academy of Sciences ice cap in the Russian Arctic. Bottom: rate of surface elevation change between January 2011 and December 2022 in metres per year.
The majority of the Academy of Sciences ice cap’s drainage basins are marine-terminating, with the North basin the only land-terminating region of the basins shown in Figure 3. Severnaya Zemlya is surrounded by the Eurasian Arctic shelf seas which in recent years have been subject to severe atmospheric and oceanic warming (Tepes et al. 2021). Glacier calving is a key factor in mass loss of marine-terminating glaciers with high rates of thinning observed in the East and South East of the ice cap.
Additionally, a significant portion of the south and south east of the ice cap has a bed elevation below sea level. Ocean warming has not only caused increased submarine melting of the glacier fronts but also significantly impacted the cavities beneath the glacier tongue due to these low bed elevations (Tepes et al. 2021). Conversely, the bed topography of the north and west of the ice cap sits above sea level with smooth sloping gradients resulting in a low gravitational driving stress (Figure 4), and thus the ice thickness variability in these regions is driven more by changes in climate.
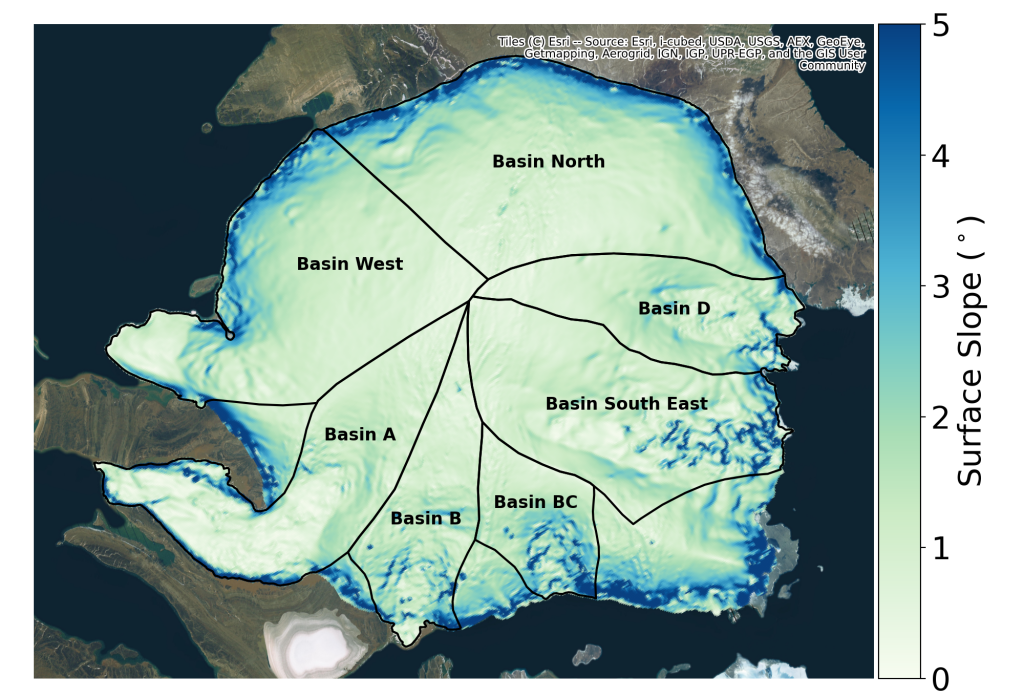
Figure 4: Surface slope of the Academy of Sciences ice cap in the Russian arctic, calculated from the EOLIS point products for 2016.
The CryoTEMPO EOLIS products in a nutshell
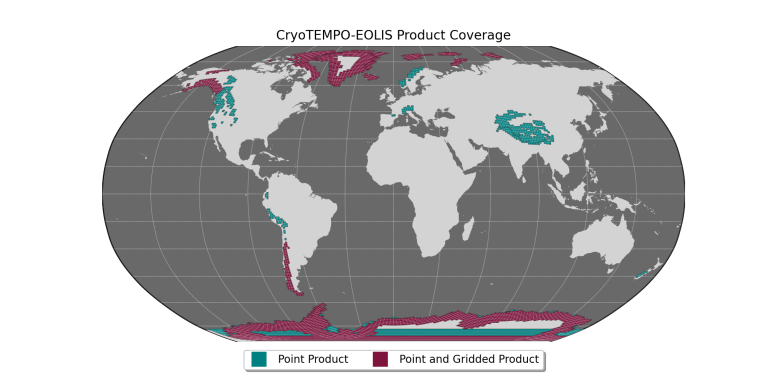
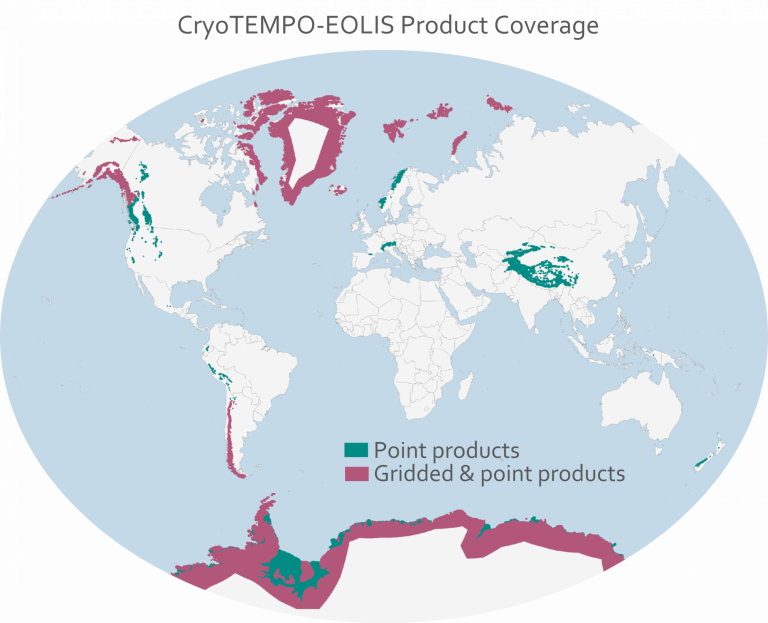
The CryoTEMPO-EOLIS products provide high temporal and spatial detail of elevation changes over the two ice sheets and glaciers across the world. The point product covers glaciers and ice caps in Iceland, Svalbard, Alaska, Southern Andes, High Mountain Asia and the Russian Arctic, as well as the two ice sheets and their periphery glaciers. The gridded products cover the Greenland ice sheet, the Antarctic ice sheet, Vatnajökull ice cap in Iceland, and Austfonna ice cap in Svalbard. These products help to facilitate the analysis of changes in land ice elevations over the last 13 years.
The CryoTEMPO-EOLIS products can be accessed via cs2eo, a high-performance geospatial-temporal query platform for Earth Observation data. Tutorials on how to work with the EOLIS product files can be found on the CryoTEMPO-EOLIS website (https://cryotempo-eolis.org/tutorials). Elevation change time series for the CryoTEMPO-EOLIS gridded products can be visualised and downloaded using the CryoTEMPO-EOLIS time series service (https://cs2eo.org/timeseries).
Further details of improvements to the CryoTEMPO-EOLIS products can be found in the CryoTEMPO-EOLIS Product Handbook and Algorithm Technical Baseline Document.
References
Berthier, E., Floricioiu, D., Gardner, A. S., Gourmelen, N., Jakob, L., Paul, F., Treichler, D., Wouters, B., Belart, J. M. C., Dehecq, A., Dussaillant, I., Hugonnet, R., Kaab, A. M., Krieger, L., Pálsson, F., & Zemp, M. (2023). Measuring Glacier Mass Changes from Space – A Review. Reports on Progress in Physics, 86(3), [036801]. https://doi.org/10.1088/1361-6633/acaf8e
Cook, A., Fox, A., & Thomson, J. (2021). Coastal change data for the Antarctic Peninsula region, 1843 to 2008 (Version 1.0) [Data set]. NERC EDS UK Polar Data Centre. https://doi.org/10.5285/07727663-9b94-4069-a486-67e4d82177d3
C.C. Walker, A.S. Gardner, Rapid drawdown of Antarctica’s Wordie Ice Shelf glaciers in response to ENSO/Southern Annular Mode-driven warming in the Southern Ocean, Earth and Planetary Science Letters, Volume 476, 2017, Pages 100-110, https://doi.org/10.1016/j.epsl.2017.08.005.
Eibl, E. P. S., Vogfjörd, K. S., Ófeigsson, B. G., Roberts, M. J., Bean, C. J., Jones, M. T., and Bergsson, B. H.: Seismic Characteristics of the Largest Measured Subglacial Flood from the Eastern Skaftá cauldron, Iceland, EGUsphere [preprint], https://doi.org/10.5194/egusphere-2022-644, 2022.
Foresta, L., Gourmelen, N., Pálsson, F., Nienow, P., Björnsson, H., and Shepherd, A. (2016), Surface elevation change and mass balance of Icelandic ice caps derived from swath mode CryoSat-2 altimetry, Geophys. Res. Lett., 43, 12,138– 12,145, doi:10.1002/2016GL071485.
Friedl, P., Seehaus, T. C., Wendt, A., Braun, M. H., and Höppner, K.: Recent dynamic changes on Fleming Glacier after the disintegration of Wordie Ice Shelf, Antarctic Peninsula, The Cryosphere, 12, 1347–1365, https://doi.org/10.5194/tc-12-1347-2018, 2018.
Gourmelen, N., Escorihuela, M., Shepherd, A., Foresta, L., Muir, A., Garcia-Mondejar, A., Roca, M., Baker, S., & Drinkwater, M. R. (2018). CryoSat-2 swath interferometric altimetry for mapping ice elevation and elevation change. Advances in Space Research, 62(6), 1226-1242. https://doi.org/10.1016/j.asr.2017.11.014
Jakob, L., & Gourmelen, N. (2023). Glacier mass loss between 2010 and 2020 dominated by atmospheric forcing. Geophysical Research Letters, 50, e2023GL102954. https://doi.org/10.1029/2023GL102954
Rignot, E., Casassa, G., Gogineni, S., Kanagaratnam, P., Krabill, W., Pritchard, H., Rivera, A., Thomas, R., Turner, J., and Vaughan, D. (2005), Recent ice loss from the Fleming and other glaciers, Wordie Bay, West Antarctic Peninsula, Geophys. Res. Lett., 32, L07502, doi:10.1029/2004GL021947.
Tepes, P., Nienow, P., & Gourmelen, N. (2021). Accelerating ice mass loss across Arctic Russia in response to atmospheric warming, sea ice decline, and Atlantification of the Eurasian Arctic Shelf Seas. Journal of Geophysical Research: Earth Surface, 126, e2021JF006068. https://doi.org/10.1029/2021JF006068
Windnagel, A., Hock, R., Maussion, F., Paul, F., Rastner, P., Raup, B., & Zemp, M. (2023). Which glaciers are the largest in the world? Journal of Glaciology, 69(274), 301-310. doi:10.1017/jog.2022.61
Links:
Dataset available here: ftp://science-pds.cryosat.esa.int/ and https://cs2eo.org/cryotempo
EOLIS website: http://www.cryotempo-eolis.org
Earthwave: http://www.earthwave.co.uk
University of Edinburgh: http://www.ed.ac.uk
isardSat: https://www.isardsat.space