
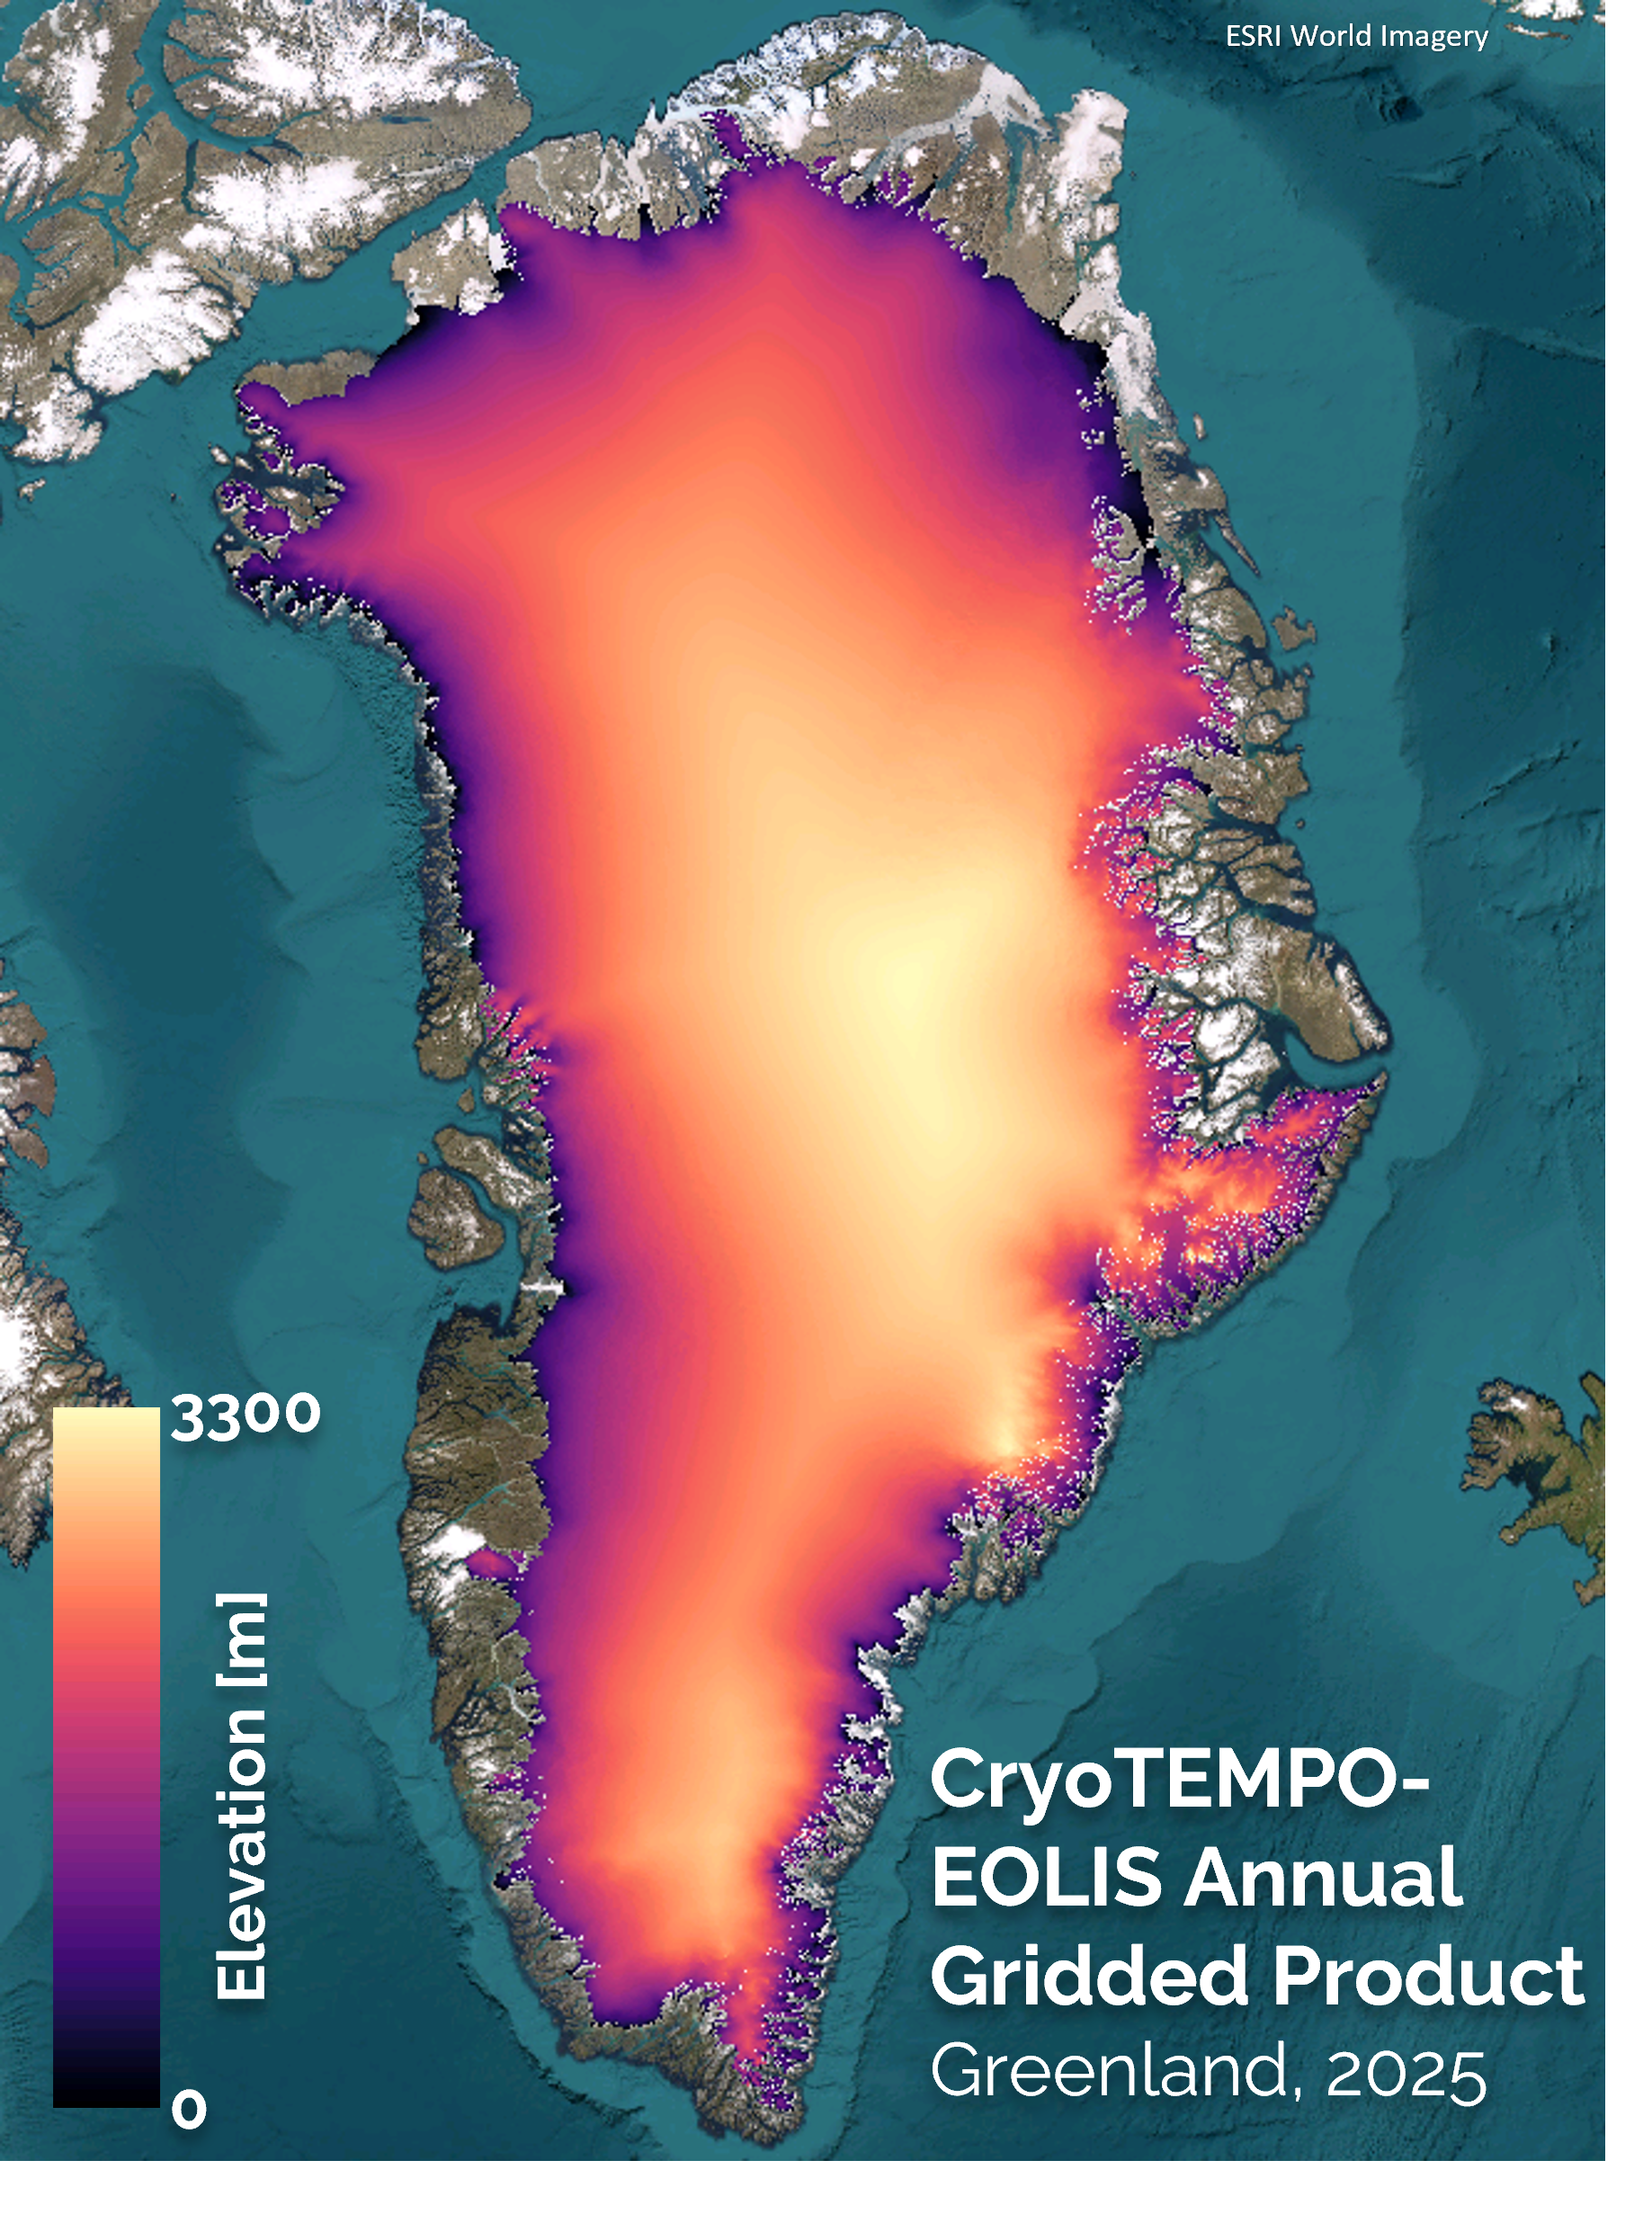
We are pleased to announce the publication of a new dataset within the CryoTEMPO-EOLIS product suite, the Seamless Annual Icesheet Product. This dataset aggregates a full year of point data to a 500m elevation grid in polar stereographic coordinates, and will be published once per year The annual gridded products are seamless DEMs, which combine CryoTEMPO Land Ice data in the LRM zone of the ice sheets with CryoTEMPO EOLIS data in the SARIn zone. Currently, this product is available for Greenland, with Antarctica (combining the ice sheet and ice shelves) to follow shortly.
This new dataset has a multitude of potential use cases, including the initialisation of ice sheet models, or as boundary conditions for atmospheric models.
In the new product, three variables are available:
Elevation [m], Uncertainty [m], Source. Full descriptions of each can be found in the CryoTEMPO-EOLIS ATBD
The data can be accessed via the ESA FTP Science Server, for direct download:
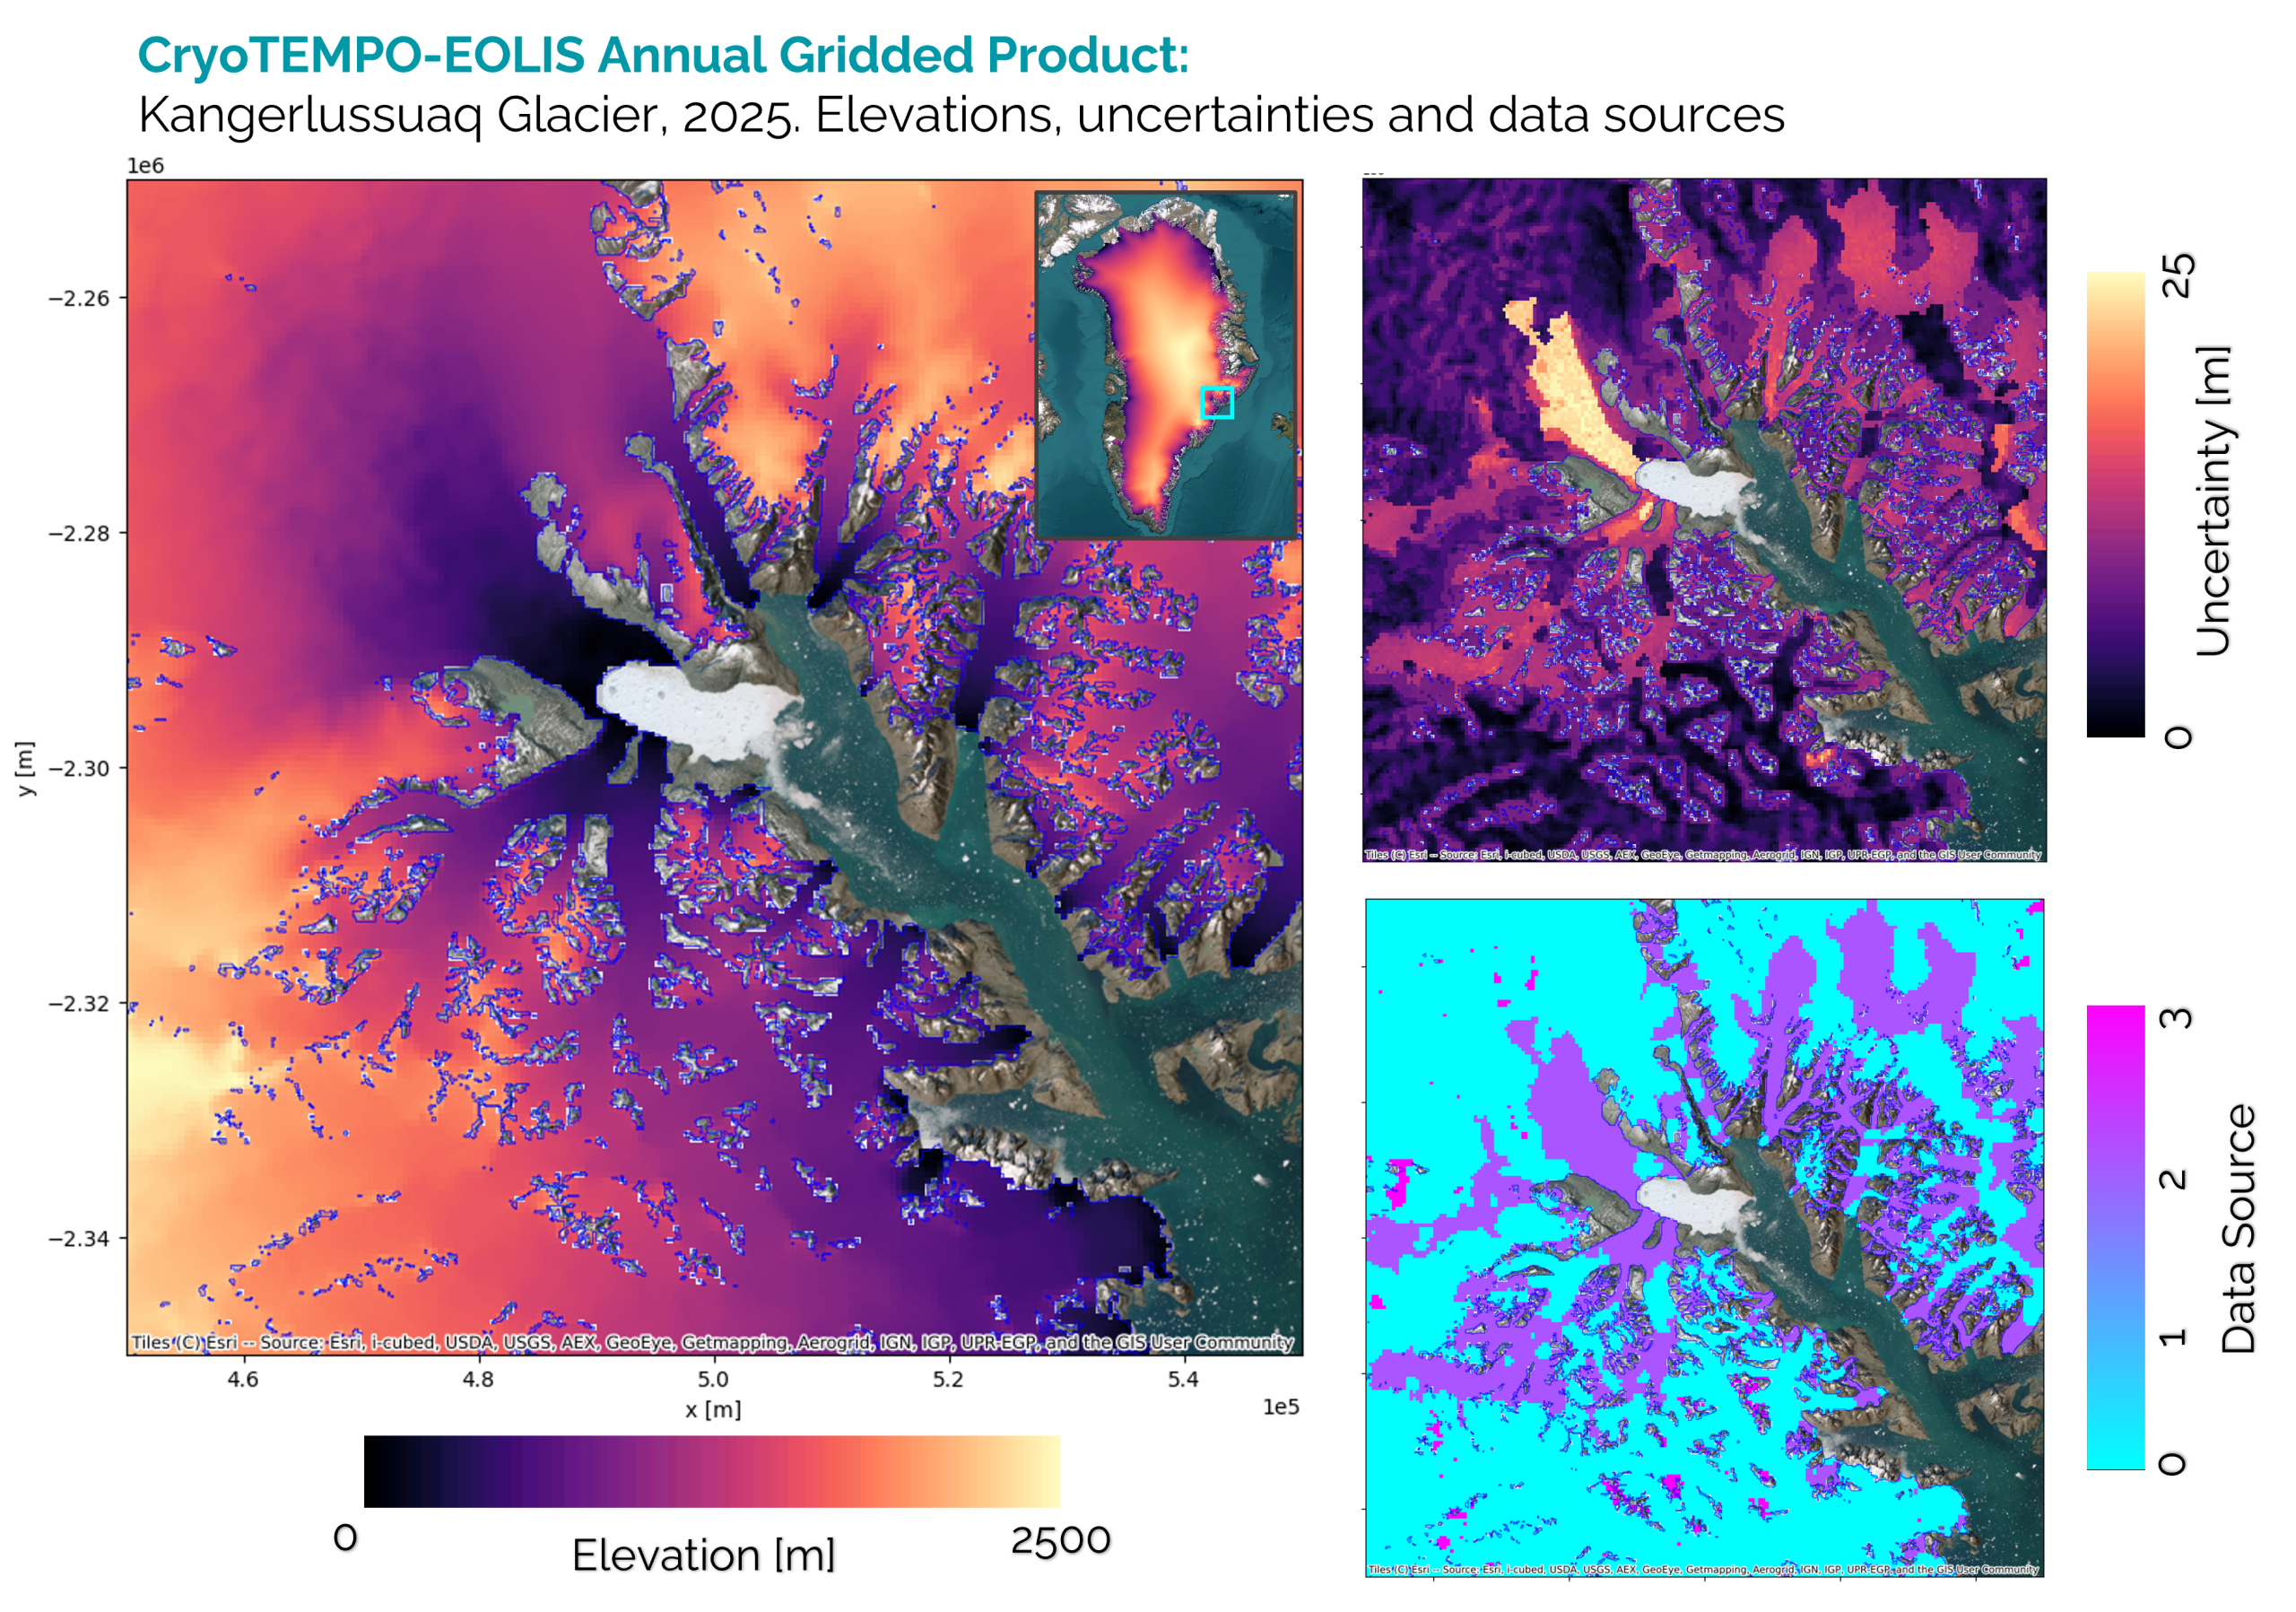
In the Figure below, the three new variables are shown over the Kangerlussuaq Glacier. This glacier is the largest on the east coast of Greenland, estimated to account for approximately 5% of all ice discharge from the ice sheet. The left panel shows the elevations measured in this area for 2025. The right panels show the corresponding uncertainty (upper), and the data sources (lower). The data source can be used to distinguish between the data fed by CryoSat measurements, and the data that is interpolated. In each panel the BedMachine land ice mask is shown, which delineates the extent of the annual gridded product.
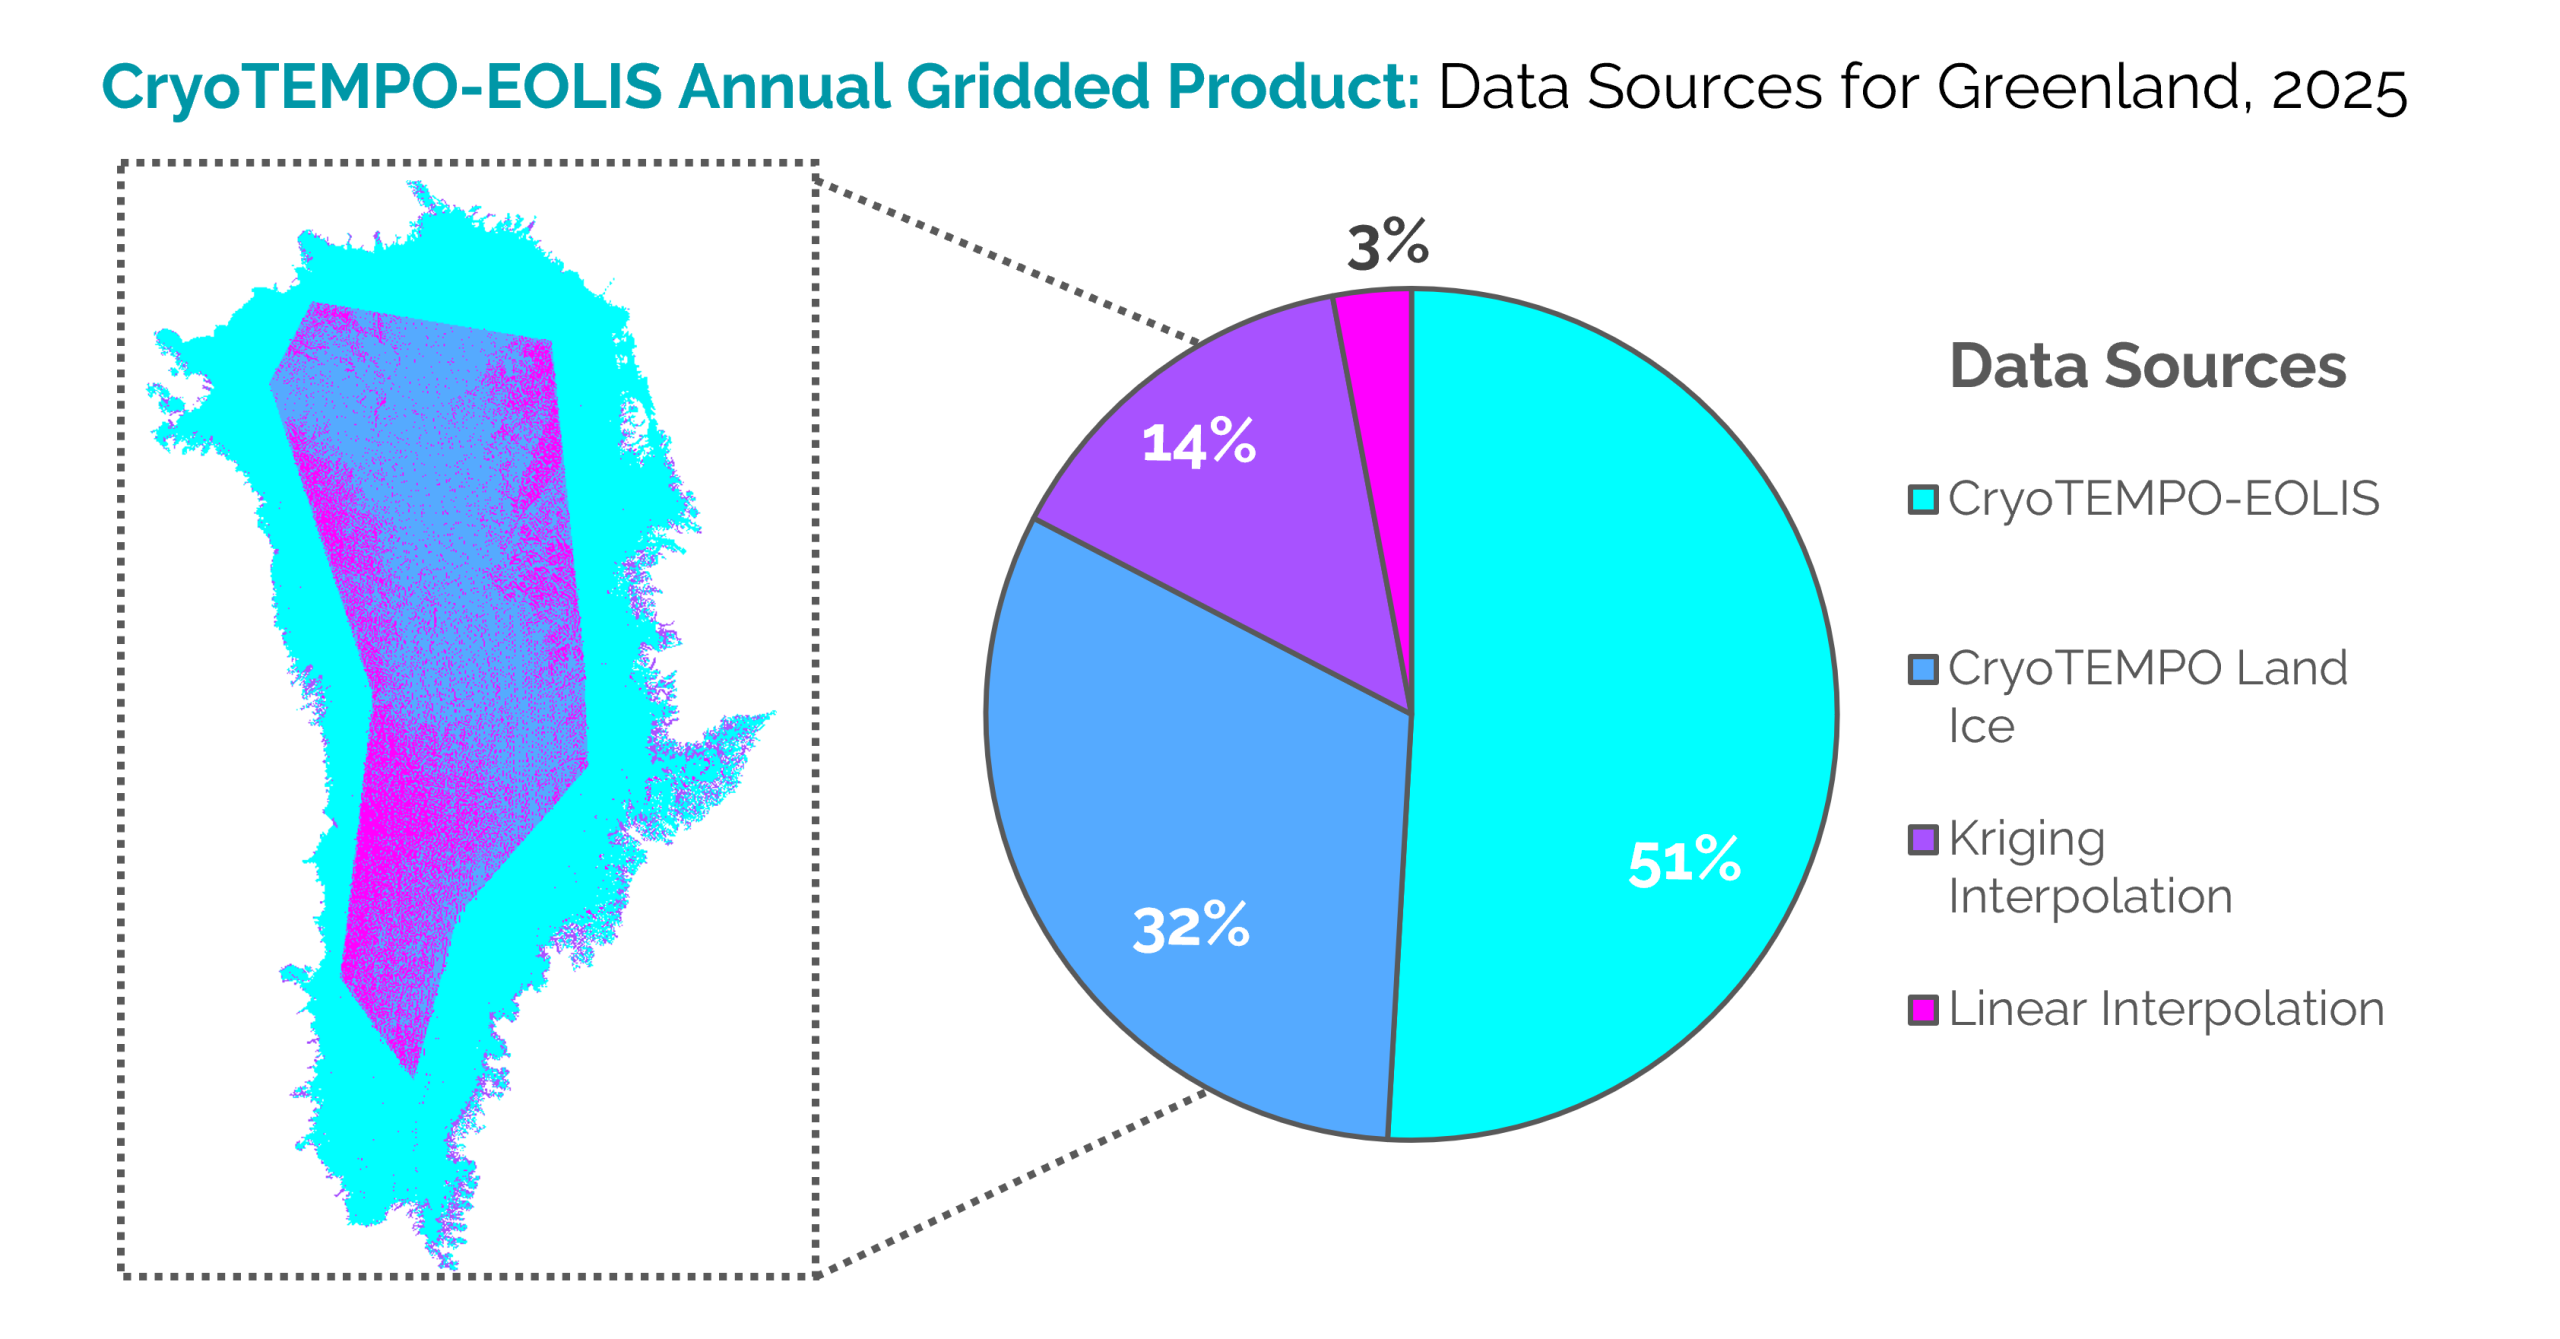
The seamless annual product combines gridded input data with interpolation to fill gaps. Two types of interpolation are utilised. The first is Kriging interpolation, which uses the ice velocity and reference topography of the surface to predict elevation measurements in locations where no observed data exists. This method is used in the largest data gaps, or in the areas with the fastest flowing ice surfaces and most extreme elevations. The second is a simpler linear interpolation, which is used to fill remaining gaps, and is the only interpolation approach utilised in the flat, relatively simple ice sheet interior. The Figure below shows the typical split of data sources in the annual product. It demonstrates the smaller quantity of interpolated data compared to observed data that comes from CryoSat-2.